It is hard to argue that higher billing rates don’t result in higher profits. Not every attorney, however, can bill at high hourly rates. Most attorneys today are trying to find ways to practice profitability in a tight billing rate environment.
Whether a firm uses hourly or non-hourly billing methods, there is an underlying cost structure that can be evaluated and often improved.
While a simple cost-per-hour analysis using firm or group totals is easy enough to prepare, it will provide limited insight. (For anyone interested in the limitations of averaging, I recommend reading The End of Average by Todd Rose.)
To allow maximum flexibility in the practice mix, we prefer evaluating profit per hour at several micro-levels. We also believe it is essential for firms to compensate partners based on the income they contribute and to empower partners to regulate their costs.
Consider the following example:
|
PRACTICE DETAIL |
Cost Allocation Method |
Business Practice (P1) |
Litigation Practice (P2) |
Insurance Defense Practice (P3) |
|
BILLING METHOD |
Complex |
Fixed by transaction type |
Hourly |
Hourly |
|
BILLING RATES |
NA |
$375-$225-$125 |
$225-$195-$95 |
|
|
STAFFING |
||||
|
Partners |
1 |
1 |
1 |
|
|
Associates |
1 |
1 |
4 |
|
|
Paralegals |
.9 |
.1 |
||
|
Secretaries |
1 |
1 |
2 |
There are several different ways to consider profit per hour including:
- By timekeeper,
- By section,
- By timekeeper type, and
- By client and matter. (We will address client/matter profitability in our next post.)
The most difficult part of analyzing profit per hour relates to cost allocation. Specifically, allocating timekeeper compensation and benefits and secretarial costs is easy to accomplish. Allocating the remaining overhead is much harder.
Many firms use estimates based on an even apportionment to all lawyers. Some firms try to recognize the difference in overhead use by apportioning it on a graduated scale (rough justice approach), with partners receiving the most and paralegals receiving the least.
Firms that require a more precise measurement may use a combination of specific and estimated allocations for all expense categories. Systems that provide improved accuracy and transparency are more likely to be perceived as credible, supporting quicker partner adoption. Since we believe the effort to create a well-designed cost accounting system and cost allocation process is worthwhile, we have created our example using this type of method.
Lastly, firms that compensate based on profitability data may want to consider a more detailed approach to cost allocation.
Consider the following cost approach used in our example.
Partner Payroll |
No partner payroll was assessed. Results were viewed in terms of return per hour. Some firms use a standard cost method to assign an amount per hour as a partner timekeeper cost. The benefits of this approach will be discussed in our next post. |
Timekeeper Payroll and Related
|
Direct allocation to each timekeeper.
|
Secretarial Payroll and Overhead Costs
|
Direct allocation to each lawyer based on sharing agreements.
|
Administrative Payroll and Overhead Costs
|
Allocated based on billable hours by section.
|
Facility Costs |
Allocated based on space usage standards. For example, average partner office, average associate office, average paralegal, average secretarial and average administrative space.
|
Equipment and Practice Aids
|
Combination of specific allocations, per seat costs for IT and general allocations.
|
Marketing and Business Development
|
Combination of specific allocation at the activity level and general allocations at the firm level.
|
CLE and Training Costs
|
Combination of specific allocations at the activity level and general allocations at the firm level.
|
General and Administrative Costs
|
Combination of specific allocations when identifiable (E.g. Malpractice) and general allocations based on applicable use.
|
|
If you want to see the detailed allocation methodology used in this example, please refer to the worksheets on our website: See WORKSHEETS. |
Using this cost allocation methodology yields the following schedule of costs per timekeeper. As we wanted to create a dynamic example, we have included a few other factors:
- Associate 3 (A3) and Paralegal (2) work remotely and do not have assigned offices.
- Practice 1 bills on a fixed fee basis but keeps track of time
- This sample firm is assumed to have good cost accounting systems and can specifically track business development, CLE, Training, Library and other costs.
- IT is assumed be cloud-based or per-seat costs are readily identifiable
- Contract CFO, HR, and Accounting all work remotely and have no need for dedicated office space.
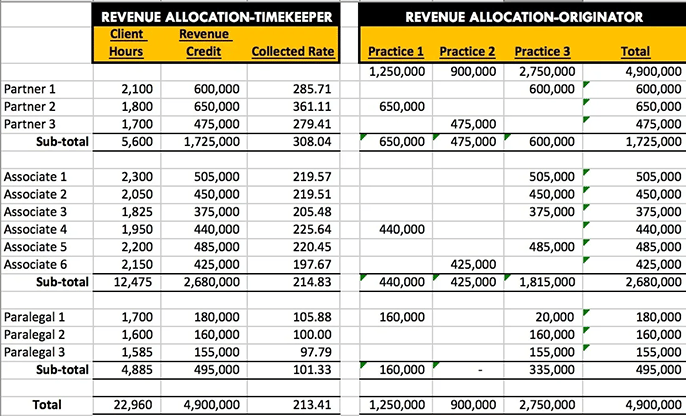
The two schedules presented below include a revenue allocation by timekeeper and originator, and a cost allocation by timekeeper and by practice group.
Revenue Allocation Timekeeper and Practice Group
The sample practice areas include a fixed fee practice, a small practice, and a leveraged practice. Included in column 3 of the first grid are the revenue amounts generated per hour.
Cost Allocation by Timekeeper
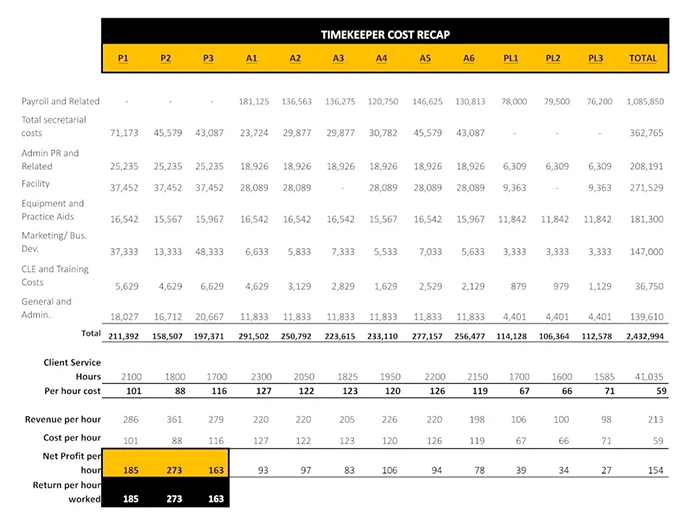
As indicated earlier, a quality cost allocation system allows a firm to evaluate the components affecting the profitability of each timekeeper, section, and, ultimately, the client.
Compare the results in the table below.
* Client service hours are synonymous with billable hours in an hourly practice.
Notice the comparison of revenue earned per hour and cost per hour. In this model, partner payroll costs are set at zero, and partner timekeeping receipts less applicable overhead is viewed as a contribution to profit for the working timekeeper. These profit contributions would then flow through to the partners’ compensation system.
Firms that pay partners separately for timekeeper contributions could insert those amounts for partner payroll costs. In this analysis, Partner 2 (P2) has the best return per hour worked. P2 has the highest billing rate and is more cost-efficient than Partner 1 (P1) and Partner 3 (P3). P3, however, has the lowest timekeeper hours and gross dollar contributions. The same type of analysis applies to all timekeepers.
Assuming the relationship between billing rates and demand is inelastic and billable hours are at or near maximum, a firm would be forced to look for other efficiencies to create profit. Comparative cost analysis at these micro levels can yield material cost-saving opportunities.
It has been our experience that the very exercise of compiling this data is enough to spur some level of improvement. When compensation is tied to the data (profitability), the pace of change becomes rapid. |
Cost Per Hour Comparison by Practice
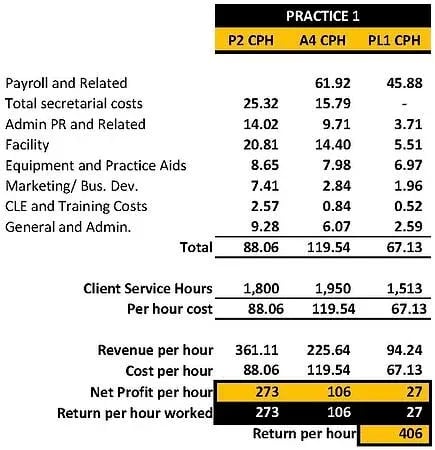
Building a comprehensive data set will enable the creation of several different comparisons. Consider the following cost and revenue per hour analysis with line item detail for each practice.
Practice 1
Combining the returns per hour worked for all of the timekeepers in Practice 1 indicates an aggregate return of $406 per hour. P2 for example, now has the data to consider if $133 per hour ($406-$273) is a fair reward for business origination, supervision, and training. A good compensation system will recognize fully these results in partner pay.
Regarding percentage margins, Practice 1 is returning 47% and 25% on associate and paralegal time, respectively. A comparison of line item paralegal costs per hour in P1 P2 and P3 indicates a potential billing rate and hours worked issue more so than a cost issue. Several other comparisons can be made making these data even more useful.
Practice 2
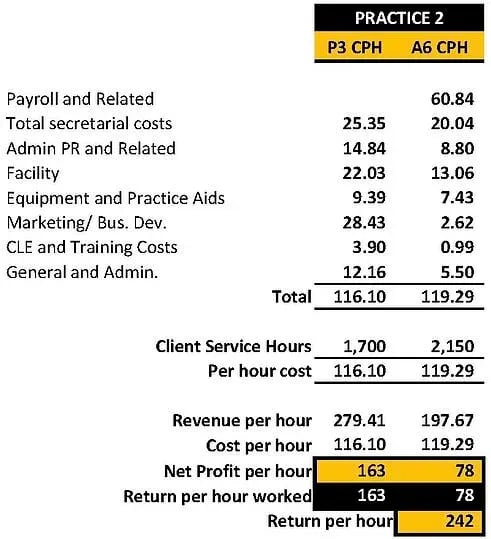
Practice 2 is returning only $242 per hour, with $163 coming from P3’s efforts and $78 coming from A6’s. Comparing A6’s salary cost per hour to those of Practice 2 and Practice 3 indicates that A6’s hourly pay is the lowest of all associates.
P3 has the lowest billing rate per hour, the least personal billable hours, and has only one additional revenue contributor. Practice 2’s marketing costs are substantially higher than Practice 1 and 3’s, which may indicate a young and building practice. It is important to consider the non-economic or strategic components accompanying a result before fully weighing an interim profit per hour analysis.
Practice 3
Practice 3 returns $663 per hour, with only $185 per hour attributable to Partner 1’s time. Practice 3 also benefits from A 3 and PL 1 working remotely without being subject to an office space allocation.
In some firms, this can be controversial, but if this example were an actual practice and the remote attorney and paralegal were delivering the indicated results, it would be foolish to allocate overhead to these positions arbitrarily.
As law firm’s look for ways to reduce costs and keep highly productive individuals, creative work arrangements can be a profitable option. Practice 3 has hit critical mass and is returning profits at or more than 40% on all associates and between 27-37% on Paralegals. P1’s personal return per hour is at the median for this firm, and the profit on the leverage more than compensates for P3’s the lower hourly billing rate.
Comparing the salary costs of Practice 3 to those in Practice 2 and Practice1 indicates that Practice 3’s compensation costs per hour are higher in most instances, which is mostly attributable to bonus costs related to higher billable hours for A1, A2, and A5 (see sample worksheets). In this example, Practice 3 can tailor its cost structure to its economic drivers.
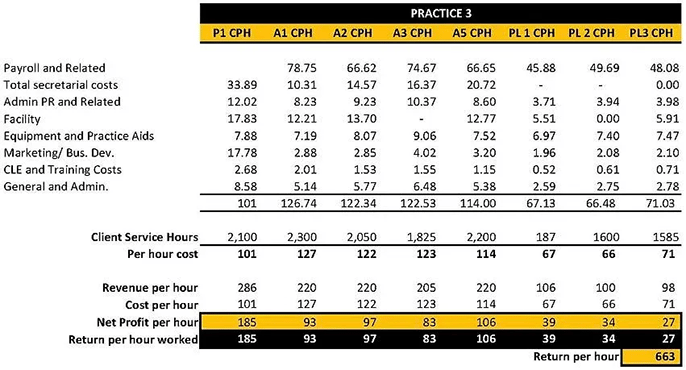
Ultimately, tying compensation to profits contributed allows these three very different practices to coexist in the same firm, with each having the opportunity to practice efficiently and be rewarded accordingly.
As mentioned earlier, performance per-hour data supported by a quality cost allocation system enables measuring performance in several ways. Consider the following performance per hour by associate comparison:
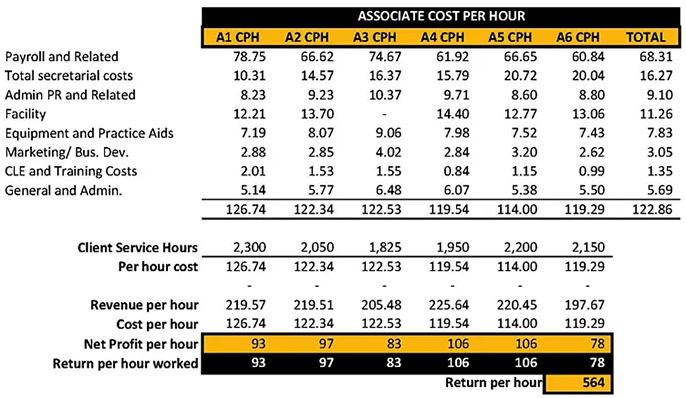
These data quickly indicate where improvement opportunities exist. Peer comparisons on a line item basis provide insights based on real examples within the same firm.
Outside benchmarks, while useful when reliable, are subject to interpretation, inconsistent cost groupings, and varied practice areas.
Developing these data internally enables a firm to create unique best practices,
which could increase firm profitability and lead to a market advantage.
Read more articles on law firm profitability:
In our next post, we will discuss client profitability and matter profitability, taking this analysis to the client and matter profitability level. The maximum value is achieved from this level of analysis when viewed from the firm's and client's (market) perspective.
.webp?width=124&height=108&name=PerformLaw_Logo_Experts3%20(1).webp)


